CHART STUDIO
Charts & Indicators, Built In
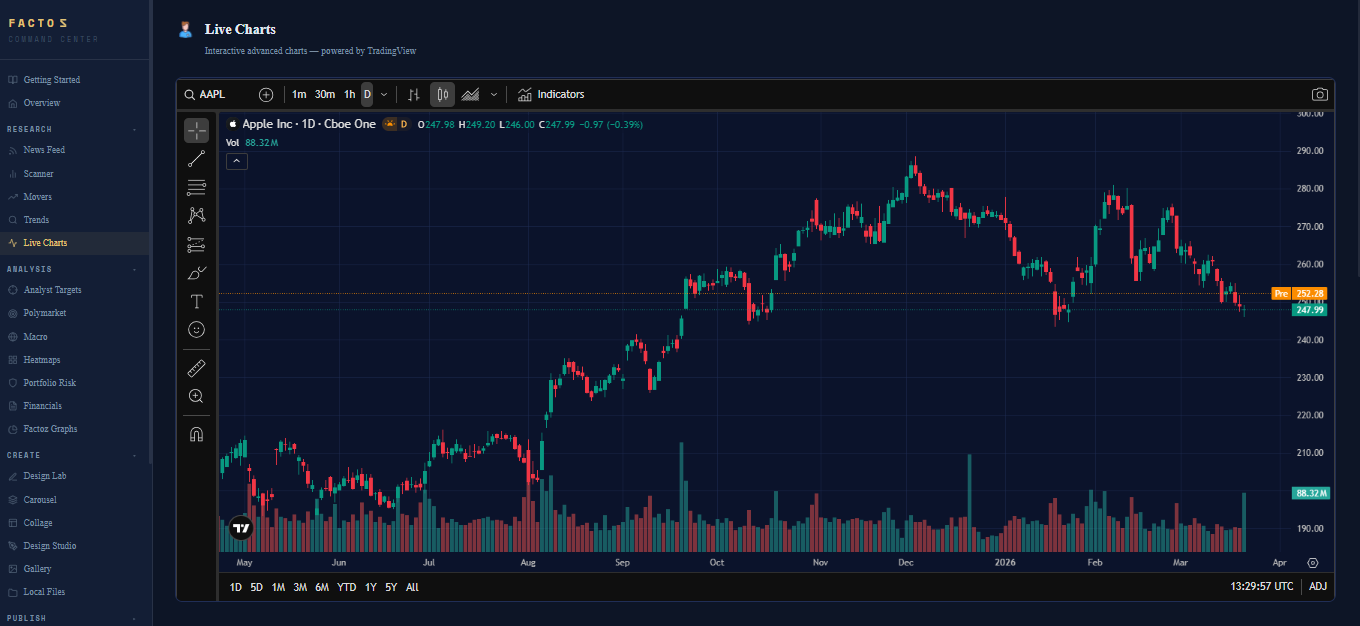
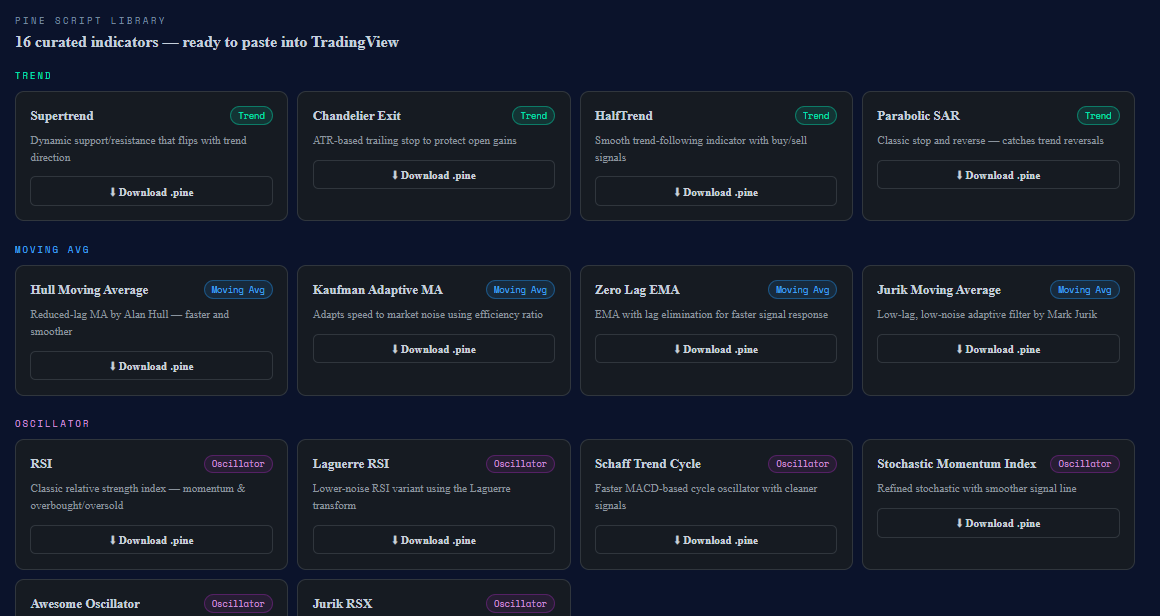
Interactive candlestick charts on any ticker — plus a curated indicator library for Pro users to download and apply directly in TradingView.
Scanner signals · Polymarket sentiment · FRED macro alerts · Earnings · DJT market moves — unified in one always-on signal feed for active traders.
Generate professional TradingView charts with custom border colors. Enter your email to unlock the chart lab + Receive Factoz Intelligence: market analysis & macro insights in your inbox.
Scan 11,000+ tickers for signals. Track macro data, sector heatmaps and prediction markets. Build AI carousels and branded content. Then schedule and publish to Instagram, X, TikTok, LinkedIn, and Reddit, all in one workflow.
Factoz scans the options market 4× daily flagging contracts with abnormal volume-to-open-interest ratios — institutional conviction before the move. Combined with pre-market movers, insider transactions, and earnings data every morning before the open.
Factoz analysts and market intelligence systems curate and publish briefings on three cadences — straight to your inbox. No login required, no manual work.
Whether you trade, manage capital, or produce financial content at scale — the market doesn't wait. Factoz was built so you don't have to.
By the time market-moving information reaches you — through news, social media, or analyst reports — institutional players have already acted. The pre-market window is short, the data is scattered, and the signal is buried in noise.
Brokerages, banks, fintech brands, and investment firms all need consistent, credible market content published across Instagram, LinkedIn, and X — every day. Agencies don't have analysts on staff. The manual workflow is broken.
Multiple scanners surface technical signals, breakouts and setups across 11,000+ tickers in seconds
Full canvas editor — build branded carousels, collages and custom designs with your own colors, logo and templates.
SEC filings, insider sentiment and key financial metrics on demand
Upcoming earnings dates and macro economic events in one view
Admin-pushed macro and sector analysis delivered to your clients
Real-time market news delivered to clients in a post-ready format
Claude reads your charts and writes ready-to-post captions with hooks
Connect your accounts in one click. Post or schedule to X, Instagram, LinkedIn, TikTok and Reddit — no API keys, no developer setup.
Ask anything. Get an AI-powered brief on any ticker, macro event or sector — instant answers backed by live market context.
Track what the world is searching. Surface trending tickers and topics before they peak.
Wall Street consensus price targets on any ticker, pulled live from analyst coverage.
See what's moving before the bell. Surface the biggest pre-market gainers and losers in one view.
Live currency rates and top cryptocurrency prices, always up to date.
Track prediction market probabilities and get alerts when odds move on key macro and political events
FRED time series and historical data: CPI, unemployment, GDP, rates and more, ready to chart and post
Build and export branded charts with your own styling, overlays and annotations, no design skills needed
Visual performance heatmap across all S&P 500 sectors, spot rotation and strength at a glance
FRED economic indicators, yield curves and market sentiment, the macro picture updated in real time
Interactive charts for any ticker with technical overlays, ready to screenshot and post instantly
Daily, weekly and monthly briefings curated by Factoz analysts and delivered straight to your inbox — pre-market, signal review, and full month recap.
Value at Risk calculations for your portfolio. Confidence intervals, drawdown estimates and risk exposure at a glance.
Run thousands of simulated portfolio paths to model potential outcomes, stress-test allocations and visualize risk distribution.
Interactive candlestick charts for any ticker — 1H, 4H, and 1D. Pro users also unlock a curated indicator library, ready to paste into TradingView.
Multiple scanners: technical setups, breakout detection, RSI, volume spikes and more. Bullish and bearish signals classified automatically, with branded chart images ready to post.
Interactive candlestick charts on any ticker — plus a curated indicator library for Pro users to download and apply directly in TradingView.
Factoz is a financial news intelligence platform. Start free and get real market intelligence from day one. Upgrade when you're ready to publish, analyze deeper, and build your edge.
Intelligence reader. Get real market data, signals and briefings delivered to you every day — no strings attached.
Intelligence agency. Everything in Free plus the full content publishing, analysis and distribution stack.
Statement generator, period-over-period comparison, AI anomaly flags, CPA review workflow, and Tax Form AI (Declaración de Renta 🇵🇦). Custom onboarding included.
Free plan is always free — real intelligence, no credit card. Pro cancels anytime. Prices in USD.
Everything you need to research, create and post — fully self-serve.
▶ Create Free Account